

IT teams typically know when a server goes down. Far fewer can see what the user is actually experiencing on their screen. Yet dashboards often show green even when the reality is different. This article is about how observability changes that.
Why Do We Monitor?
Most IT teams say they monitor to be notified when something stops working. That is understandable – but insufficient. The real purpose of monitoring is not to measure availability. The goal is to ensure users receive a service of adequate quality. Availability is only a proxy — important, but not identical to the end goal. When this perspective is adopted, different questions come to the fore: is response time acceptable? Where is time being consumed in the service delivery chain? And what percentage of users receive a flawless response?
The Uptime Trap
Availability metrics – those “nines” SLA figures – create a false sense of security. 99.9% availability sounds convincing. But what does it not measure?
It does not measure whether response times are acceptable. It does not measure whether the mobile application crashes on certain devices. It does not measure whether users connecting via a particular ISP’s network receive slower service than those connecting from elsewhere.
The server “works” – but the user experience can still be unacceptable. This is the uptime trap: the metric shows green while the actual reality tells a different story.
“Everything Is Green” – And Yet Users Are Complaining
IT teams often find out from the call center that something is not working properly. By the time the helpdesk flags the issue, users have already been experiencing the problem for minutes or hours.
Traditional monitoring tools measure within their own system boundaries. They alert when a server fails to respond – but they cannot see what the user is experiencing on their screen. A mobile application may crash regularly on specific devices without triggering a single alert. Users connecting via a particular mobile carrier’s network may receive slower service than others, while every server-side metric looks perfectly normal.
Observability makes the entire service delivery chain visible: from the moment a user submits a request to the moment the response appears on their screen. This is the field of view that allows an IT team to genuinely see through the eyes of the user.
The NEAK Case – When the Stakes of User Experience Are Exceptionally High
The National Health Insurance Fund of Hungary (NEAK) develops and operates the National eHealth Infrastructure (EESZT) and the HealthWindow (EgészségAblak) application. On an average day, approximately 950,000 electronic prescriptions pass through the system – a figure that can reach 1.3 million in early December, with traffic typically spiking 20 percent at the start of each month.
In this environment, a slowdown is not an abstract degradation of performance metrics: the pharmacist waits longer for the prescription, the patient stands longer at the counter. The system is “working” – but the consequences are felt by the user.
In this context, observability is a strategic instrument. The team can detect when a new release causes more crashes in the mobile application – before anyone has filed a complaint. It can verify whether a database upgrade has actually improved response times. And it can identify when users connecting via a specific mobile carrier’s network are receiving slower service, even when everything appears normal on the server side.
What Does Observability Give Organizations?
Observability drives meaningful change across three dimensions. It makes the true state of the user experience visible – not just whether the server responded. It surfaces where problems originate before the helpdesk raises an alert. And it provides a shared picture for all teams involved, enabling faster and more effective incident resolution.
Understanding the true state of the user experience means that the IT team is not watching the server’s internal metrics – it is watching what the user actually experiences: response times, application errors, and service quality. This is a fundamental distinction: a system can appear “healthy” internally while the user experience is unacceptable.
Proactive fault detection enables the team to stop reacting after the fact. A slowing database query, a rising error rate in the mobile application, a performance degradation forming ahead of a traffic peak – all of these can be identified before the user feels the impact. That is the intervention window in which intervention is still possible.
A shared data picture during an incident means that all teams involved are looking at the same thing: the complete service delivery chain, in real time. Diagnosis is fast, accountability is clear, and remediation is focused. IT spends less time firefighting, and more time ensuring the system genuinely works well from the user’s perspective.
Observability – Through the Eyes of the User
For users, only one thing matters: that the service works properly. Monitoring tools, however, have primarily measured the state of systems. The actual experience of the user has long remained outside the field of view.
Observability does not give IT a new goal – it returns IT to its original one. It makes visible what could previously only be inferred: what the user is experiencing on their screen, where time is lost in the service delivery chain, and where intervention is warranted.
This shift in perspective is not purely a technical matter. It changes what the IT team measures, how it communicates with developers, and how operations can give leadership a meaningful picture of the system’s true state.
When there is a shared benchmark – the user experience – priorities become clearer, incident resolution becomes faster, and development becomes more purposeful.
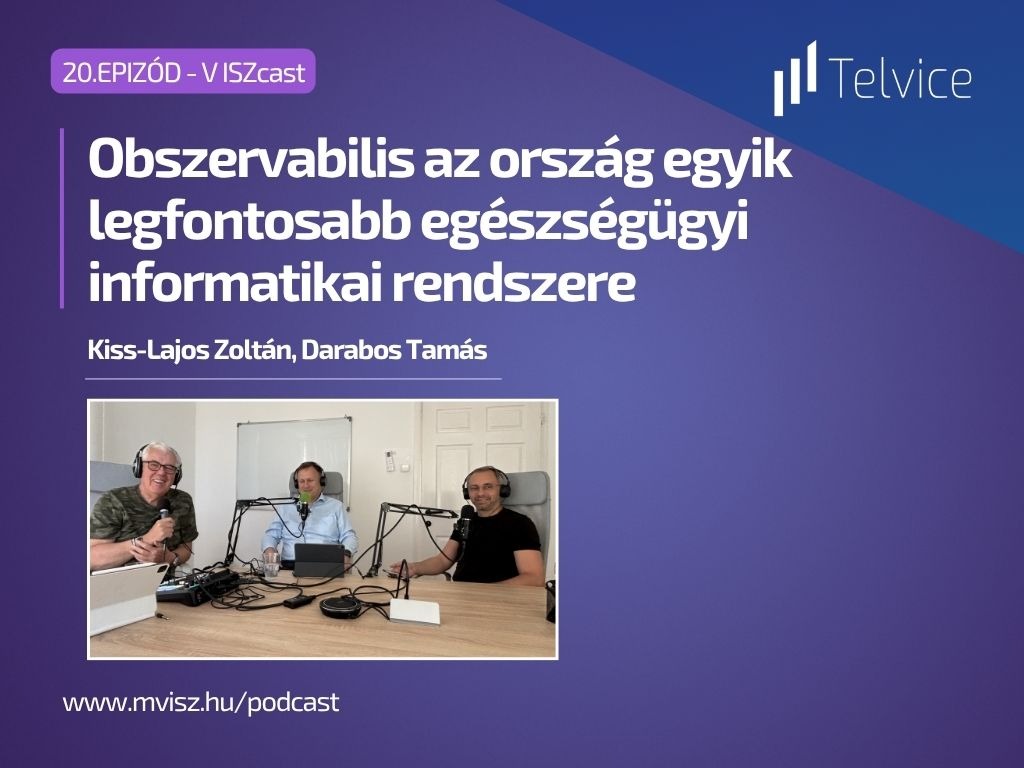
This topic was explored in greater depth in the latest episode of the VISZcast podcast, where Sándor Mester spoke with Zoltán Kiss-Lajos, Director of Sectoral Systems at NEAK, and Tamás Darabos. Listen here:
Source
Zoltán Kiss-Lajos, Director of Sectoral Systems, NEAK Nonprofit Kft. – VISZcast podcast, Episode 2 (Telvice × VISZ Observability Series)
